What is an X-Y Axis?
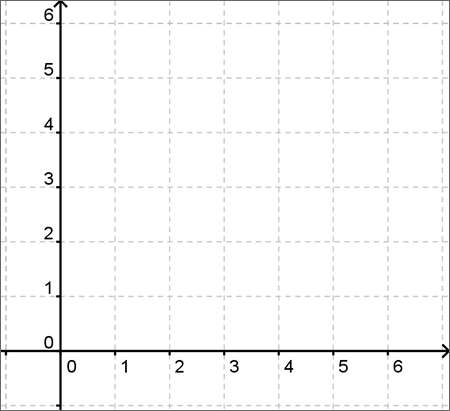
An x-y axis, also known as a cartesian coordinate system or a coordinate plane, is a two-dimensional plane of points defined uniquely by a pair of coordinates. What does that mean? Every point on the plane is represented by two numbers, known as its coordinates. Those coordinates measure the distance of the point from the x-axis and the y-axis. It will become more clear when we look at this graphically.

The vertical line is known as the y axis. It is nothing more than a measuring stick to count how far "up or down" a point is from the horizontal line. The horizontal line, then, is known as the x axis and measures the distance left or right from the vertical line. See what I mean?

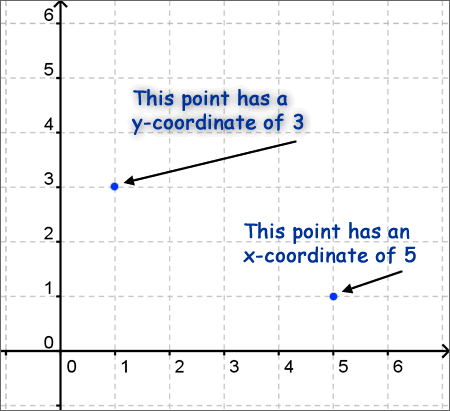
To plot a single point on the axis, we start with a coordinate, which is a pair of points each representing a distance travelled on an axis. The x-axis comes first, and then the y-axis. For the point (1,2), the x- coordinate is 1 and the y- coordinate is 2. Here's how we'd plot that on a graph:

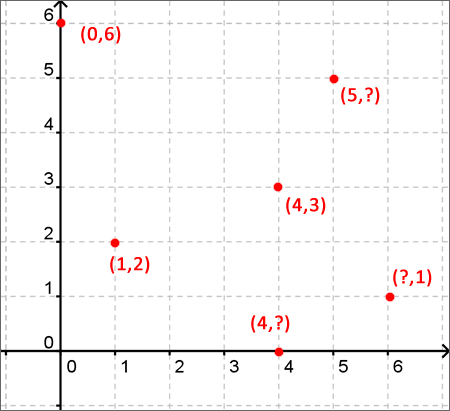
Any other point is plotted in the exact same manner. The plot below has several points marked, some with missing coordinates. Can you figure out the missing numbers?

With this simple understanding of the x-y axis, you'll be able to plot not just points, but eventually lines, curves, and other shapes all represented by various equations.
