What is the slope of a line?
The slope of a line is its angle, or steepness. It can be positive, if the line slopes upwards as the we look from left-to-right, or it can be negative, if the line slopes downhill from left to right.
Example:
Here's a graph of the equation \(y = 2x\) (red) and the equation \(y=0.5x\) (blue). Note how the red line goes up 2 points for every 1 point it goes to the right. The blue line goes up 1/2 a point for every point it goes right.

Horizontal and Vertical Lines
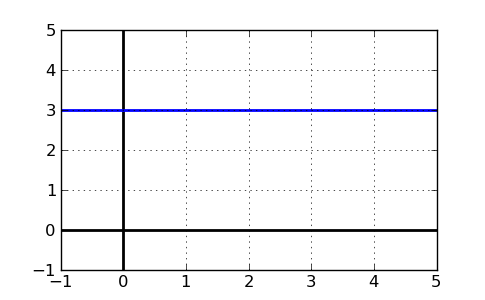
A horizontal line is perfectly flat. It has no "steepness" and neither goes up nor down. Mathematically, we can express that by saying that a horizontal line has a slope of 0. The graph below has a slope of 0, and you can see that it has no steepness, or slope (it's flat!).

If a horizontal line is flat, what about a vertical line? This type of line goes straight up and down, so it doesn't really have a defined slope we can measure. In fact, a truly vertical line has an infinite slope. Here's an example of a vertical line:

Calculating a Slope
You may be curious how we determine what the slope is, exactly. A slope is the change in y over the change in x. That means that if you had two points in a line, \((0,0)\) and \((2,2)\), the slope could be calculated like this:
$$ \frac{\text{change in y}}{\text{change in x}} = \frac{y_2-y_1}{x_2-x_1} = \frac{2-0}{2-0}=1 $$Here's what we did:
- Find two points on the line
- Find the coordinates of the first point \((x_1,y_1)\) and the coordinates of the second point \((x_2,y_2)\)
- Plug in to the formula above, or simply determine the change in y and divide by the change in x.
How to graph a line with a given slope
Now that we know how to calculate a slope, we must figure out how to graph the line. A line is often written in slope-intercept form, y = mx + b where m is the slope and b is the y-intercept. The y-intercept is the point where the line intersects the y-axis. If you are given y = 2x + 0, then the line has slope 2 and a y-intercept of 0. Since the y-intercept is 0, we know one point, (0,0). Because the slope is 2, or 2/1, we have to go up 2 for every 1 we go right. The line looks like this:

As you can see, the line goes up 2 points for every 1 points it goes right, meaning that the change in y is 2 when the change in x is 1. Slope = 2. For more information, please view our lesson on graphing lines.
Summary
The slope of a line is the change in y divided by the change in x between two points. It's also the amount a line "goes up" for every one point it goes right. Some call it "rise over run". Either way, given two points, you can always find the slope of the line with that quick formula.
Slope-related Math Lessons:
Slope-related Links
- Slope of a straight line
- Slope (wikipedia)
- Slope
