Hi,
I know I am missing something obvious here but just can't understand what I am getting wrong.
I was trying to graph this equation
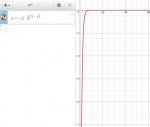
y=-2*3(5-x)
It is related to a problem I was working on in Khan Academy - but I went on a tangent of thinking.
When I graph this function using Desmos it looks very much like the domain of the function is x>0. This also seems to match my lessons.
However when I decide to just impose a negative x value, say x=-1 then the function 'appears' to throw out a value.
y=-2*3(5--1)
y=-2*3(5+1)
y=-2*3(6)
y=-2*729
y=-1458
so for x=-1, y=-1458
Why does this not graph. My below graph seems to indicate -1 is outside the domain of the function? What am I missing - please help this is driving me crazy!!!! (many thanks in advance)

I know I am missing something obvious here but just can't understand what I am getting wrong.
I was trying to graph this equation
y=-2*3(5-x)
It is related to a problem I was working on in Khan Academy - but I went on a tangent of thinking.
When I graph this function using Desmos it looks very much like the domain of the function is x>0. This also seems to match my lessons.
However when I decide to just impose a negative x value, say x=-1 then the function 'appears' to throw out a value.
y=-2*3(5--1)
y=-2*3(5+1)
y=-2*3(6)
y=-2*729
y=-1458
so for x=-1, y=-1458
Why does this not graph. My below graph seems to indicate -1 is outside the domain of the function? What am I missing - please help this is driving me crazy!!!! (many thanks in advance)