Transformations of Graphs - Write an equation for the graphs

Katarina

New member
Joined
Jul 4, 2013
Messages
4
Solved omg yay!!!

Hi everyone.

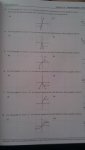
I've just had class today at summer school and I have some homework and there is one page that I do not understand how to do. There are answers at the back but they don't show the steps on how to get the answer. I have a test tomorrow so if anyone can help me on how to do these it would be very much appreciated!

Bigger image link: http://imageshack.us/a/img5/1992/ki15.jpg
 

Attachments

  • IMAG1530.jpg
    IMAG1530.jpg
    99.2 KB · Views: 4
Last edited:
there is one page that I do not understand how to do

Is this because you have questions about your lessons or materials, or is it because you never received instruction?

Here is a link to a lesson page, found by googling.


Are you sure that you cannot do the first exericse? They want the equation for the line that passes through points (0,0) and (-1,-4). You could begin by using the slope formula.

The y-intercept is clearly zero, on that graph, so the equation for part (a) must be of the form y=mx.


For the second exercise, review the lesson page linked above. Some examples on that page are similar.


See how far you can get! If you need more help or confirmation, please ask specific questions or post your efforts. We can also help you find more lessons (like videos), if you have trouble understanding what you've already seen. :cool:
 
Yes, I've received instruction, but I just don't really get it. Thanks for the link! I'll check it out!
 
Yes, I've received instruction

Oh good; sometimes, teachers skip over stuff. Please post any specific questions about lesson parts that you don't get.

With transformations, we're basically multiplying by a constant. When we multiply all the inputs by some constant, it changes the behavior of the function, and we get a new graph. When we multiply a function's outputs by the same constant, we get another transformation.

Do you have graphing technology?

You may experiment by first graphing f(x)=x^2, followed by graphing examples like f(2x) and f(5x), or 2f(x) and 5f(x). What transformations do you see, when the inputs get multiplied by a constant? Likewise, what happens when the outputs get multiplied by a constant?

Multiplying a function output by 1 does not do anything because 1f(x) is the same as f(x). But, what happens when the outputs are all multiplied by -1?

Graph f(x) and -f(x). You should see a reflection across the x-axis. That makes sense. Multiplying by -1 changes the sign of all the y-coordinates, so parts below the x-axis (where y is negative) get flipped above the axis (where y is positive), and vice versa.
 
Hi! thanks for the reply!

like I know how to draw the equation or be given a point on f(x) and find the new point on like for example y=f(x=2) but I don't know how to find the equation from the graph! omg im so dumb and frustrated i want to cry omg times running out omg

like whats use the graph of x^3 like it doesnt show it so how can i compare the two :(

and like i get what to do when the graph moves up and down or left to right but when it's like 4x^3 or something with a number in front its hard
 
Last edited:
OMG!! ok my friend worked it out for me!!!

i took the points they game me and took the X and plugged it into the given f(x) so like for #6 its (2,-4) and we took 2 and absoluted it so the original point was (2,2) then we took the given y and divided it by the original y so its like -4/2 and the answer is -2 and the finial answer is just that number put in from of the original f(x)

and the answer is -2|x|

yay! im so relieved! ok bye!
 
Top