Diana_cthulu
New member
- Joined
- Jan 25, 2018
- Messages
- 2
Sketch graph of piecewise function f(x) = 1+x [x<-1], x^2 [-1<=x<1], 2-x [x>=1]
I am really confused on how to start the graph in (Q.11) and from where do i get the points in order to plug it in the graph
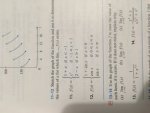
11. Sketch the graph of the function and use it to determine the values of a for which \(\displaystyle \lim_{x \rightarrow a}\, f(x)\) exists.
. . . . .\(\displaystyle f(x)\, =\, \begin{cases}1\, +\, x&\, \mbox{ if }\, x\, <\, -1\\x^2&\, \mbox{ if }\, -1\, \leq\, x\, <\, 1\\2\, -\, x&\,\mbox{ if }\, x\, \geq\, 1\end{cases}\)
I am really confused on how to start the graph in (Q.11) and from where do i get the points in order to plug it in the graph
11. Sketch the graph of the function and use it to determine the values of a for which \(\displaystyle \lim_{x \rightarrow a}\, f(x)\) exists.
. . . . .\(\displaystyle f(x)\, =\, \begin{cases}1\, +\, x&\, \mbox{ if }\, x\, <\, -1\\x^2&\, \mbox{ if }\, -1\, \leq\, x\, <\, 1\\2\, -\, x&\,\mbox{ if }\, x\, \geq\, 1\end{cases}\)
Attachments
Last edited by a moderator: