You are using an out of date browser. It may not display this or other websites correctly.
You should upgrade or use an alternative browser.
You should upgrade or use an alternative browser.
separable first order ODEs
- Thread starter Sohail
- Start date
- Joined
- Apr 12, 2005
- Messages
- 11,339
Why would that large a class have such a similar property? I think not.
There are some pretty obvious ways to find symmetry, other than graphing and looking. You may also wich to check for periodicity.
Check for symmetry about the line x = y. You may recognize this as relating to an old-fashioned function inverse. Swap x and y and see if you get the same answer.
Check for horizontal symmetry about x = 0. Substitite x = -x and see if you get the same answer.
Vertical about y = 0. y = -y
What would this do? Convert to polar coordinates and substitute r = t*r
Just think it through. Whatever symmetries you seek, invent a test for it.
Thanks for kind reply!
Would the techniques mentioned above give us all the necessary information(I mean complete), or the tests are just sufficient? I doubt this, consider:
(sorry I don't know enough latex)
y` = exp(y)*sin(x)
The directional field of the above ODE is symmetric with respect to y-axis, however the prescribed test points otherwise, as:
f(-x,y) = exp(y)*sin(-x) = -exp(y)*sin(x) != f(x,y) = -f(x,y)
Which implies a symmetry with respect to x-axis, which may also be true(I have not checked graphical), but the question here which concerns me here is that its not showing us the symmetry with respect to y-axis.
Thanks!!
- Joined
- Apr 12, 2005
- Messages
- 11,339
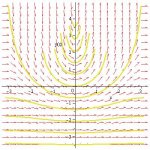
Sohail said:The directional field of the above ODE is symmetric with respect to y-axis
Why do you believe that? Maybe I'm drawing the wrong picture. What about sin(x) would produce horizontal symmetry across x = 0?
Attached is the image file of the phase portrait of solution curves for the series of initial value problems at y(0)=-k*log(2) as generated by maple 13.[attachment=0:39k7mkyh]directional field_2.jpg[/attachment:39k7mkyh]
As the given IVP have solution on whole real line only for the initial condition y(0)< -log(2).
The commands that I have used to generate to get the above pic are:
de := diff(y(x), x) = exp(y(x))*sin(x);
with(DEtools);
##DEplot(de, y(x), x = -Pi .. Pi, y = -3 .. 3, arrows = medium, color = rhs(de));
phaseportrait(diff(y(x), x) = exp(y(x))*sin(x), y(x), x = -Pi .. Pi, [[([y(0) = -k*log(2)] $ k = -5 .. 5)]);
Attachments
D
Deleted member 4993
Guest
If you put a mirror at the line x=0 - would get the picture as drawn?
The answer is NO - look at those curves carefully and think about and think about it.....
If the mirror cannot complete the picture - then it is not mirror image - not symmetric (in that sense)
The answer is NO - look at those curves carefully and think about and think about it.....
If the mirror cannot complete the picture - then it is not mirror image - not symmetric (in that sense)
I accept that my argument regarding mirror image was not correct, and I hold back my argument on the direction field of ODE symmetric with respect to y-axis for a moment.
But as already shown analytically, these solution curves has to be symmetric with respect to x-axis. But I could not see that symmetry in above plot.
But as already shown analytically, these solution curves has to be symmetric with respect to x-axis. But I could not see that symmetry in above plot.