Hi
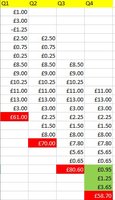
Every quarter, I receive a single aggregate value of the spend in the last 12 months. I have 4 such aggregate values received over the previous 4 quarters.
However, this quarter, I have to find out what is the spend in the previous 3 months. Is there anyway to do this with the 4 aggregate values?
In the attached sample image with made-up numbers - I have the values in Red and using that I have to find the values in green - In the attached example the answer I want is £5.85? Is there anyway I can derive this mathematically i.e. from the 4 aggregate values can I derive the quarterly figure.
Many thanks for your time to look into this.
Attachments
Last edited:

