You are using an out of date browser. It may not display this or other websites correctly.
You should upgrade or use an alternative browser.
You should upgrade or use an alternative browser.
Pls help me in solving this question. Thanks
- Thread starter newuser
- Start date
HallsofIvy
Elite Member
- Joined
- Jan 27, 2012
- Messages
- 7,763
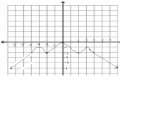
Are you saying that you have no idea what these mean? The inequalities just say "f(x) (the value of the function) is larger than 3" and "f(x) (the value of the function) is less than 0".
f(x) is the y value. To find what values of x make those true, I recommend drawing (or imagining) a horizontal line at y= 3. Look at the part of the graph, if any, that is above that line. What are the corresponding x values?
Then draw a horizontal line at y= 0 (that is, by definition, the x-axis). What parts of the graph are below that line? What are the corresponding x values?
mmm4444bot
Super Moderator
- Joined
- Oct 6, 2005
- Messages
- 10,962
Hi newuser:
Until you ask some questions of your own (or explain why you're stuck), tutors cannot determine how to help you.
Please read the post titled "Read Before Posting" for information on how to ask for help.
Cheers ~ Mark :cool:
Until you ask some questions of your own (or explain why you're stuck), tutors cannot determine how to help you.
Please read the post titled "Read Before Posting" for information on how to ask for help.
Cheers ~ Mark :cool:
Are you saying that you have no idea what these mean? The inequalities just say "f(x) (the value of the function) is larger than 3" and "f(x) (the value of the function) is less than 0".
f(x) is the y value. To find what values of x make those true, I recommend drawing (or imagining) a horizontal line at y= 3. Look at the part of the graph, if any, that is above that line. What are the corresponding x values?
Then draw a horizontal line at y= 0 (that is, by definition, the x-axis). What parts of the graph are below that line? What are the corresponding x values?
I am confuse. I think the answer will be null i.e. we don´t have any value.correct?
HallsofIvy
Elite Member
- Joined
- Jan 27, 2012
- Messages
- 7,763
You gave two questions. Which are you referring to? One of the problems has the null set as answer, the other does not.I am confuse. I think the answer will be null i.e. we don´t have any value.correct?

