the problem:
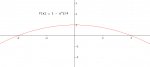
f(x) = 1−((x^2)/4), for−2 ≤ x ≤ 2
with f(x+3) = f(x)
the Question: plot the function.
i can do the first line, but i do not understand what the second line means.
does it mean f(x+3) = f(x) = 1−((x^2)/4), for−2 ≤ x ≤ 2 ?
how does f(x+3) = f(x) ???
and what does plot the function imply? f(x+3)? f(x)?
thanks in advance