Piecewise Help!!!

kristinelizabeth23

New member
Joined
Apr 4, 2011
Messages
3
Hi, I was wondering if someone could try to teach me how I would go about to solving a problem like this. It is a piecewise problem. My teacher just kind of blew over this topic and I'm so lost!!
here is an example problem:
Sketch the Graph:

f(x)={ x squared -1 if x is less than or equal to 1
x+1 if x is greater than 1
 
kristinelizabeth23 said:
Hi, I was wondering if someone could try to teach me how I would go about to solving a problem like this. It is a piecewise problem. My teacher just kind of blew over this topic and I'm so lost!!
here is an example problem:
Sketch the Graph:

f(x)={ x squared -1 if x is less than or equal to 1
x+1 if x is greater than 1

First of all, as tkhunny always says, have confidence in yourself; you are never as lost as you think you are.

I'm not sure of what piecewise means in this context; perhaps I have forgotten because it has been a long time (a millenium in fact) since I was in school. HOWEVER, the problem gives me a clue.

Could you sketch a graph of y = (x + 1)? Could you sketch a graph of y = (x[sup:2bwtgoo8]2[/sup:2bwtgoo8] - 1)? Well in this case the expression describing y is (x[sup:2bwtgoo8]2[/sup:2bwtgoo8] - 1) if x <= 1, but (x + 1) if x > 1. So just a piece of the graph for x[sup:2bwtgoo8]2[/sup:2bwtgoo8] - 1 is relevant. What piece of the range is it relevant for? Can you sketch the piece of the graph of (x[sup:2bwtgoo8]2[/sup:2bwtgoo8] - 1)that is relevant over the peice of the range that is relevant? That, however, only graphs a piece of the range. How about the other piece of the range? If you can sketch the graph of y = (x + 1) for every real number you certainly know how to draw the graph for a piece of the real number line. What piece?

BEHOLD. You have done it.

Now if I have been unclear, please tell me where, and we can continue.


Do you know how to graph the following equations?

y = x^2 - 1

y = x + 1

The graph of the piecewise function in your exercise is two parts from above combined together in a single graph.

To the left of x = 1, you'll have part of a parabola; to the right of x = 1, you'll have a straight line.

It is standard to put a solid dot at the endpoint of a graph segment to show that the endpoint is included in the graph.

It is standard to put an open circle at the endpoint of a graph segment to show that the endpoint is not included in the graph.

I uploaded the graph of an example below.

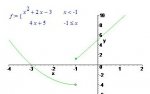
In this example, we have the graph of x^2 + 2x - 3 to the left of the vertical line x = -1.

We have the graph of 4x + 5 to the right of the same vertical line.

The two graph segments are combined together in a single graph.

This piecewise-function's definition tells us that the parabola is not included at x = -1 and the graph of the straight line is included.

Hence, there is an open circle at the endpoint of the parabola (to show that it's not included in the graph), and there is a solid dot at the endpoint of the line (to show that it's included in the graph).


[attachment=0:lzcadkgz]Piecewise.JPG[/attachment:lzcadkgz]


Attachments

  • Piecewise.JPG
    Piecewise.JPG
    18.1 KB · Views: 48
Top