First I'll apologise if this is in the wrong forum and don't mind it being moved.
I have a problem on an A2 maths question, I think C3 if this helps.
The Question is:
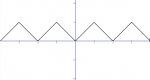
The function f is even, periodic with period 2 and, for X 0-1 (can be 0 and 1), f(X)=X. Sketch the graph of f(X) = 1-X
How do I sketch graphs depending on whether they are even/odd, what do do with different periods and the range of values X can take?
I assume the period means I might just duplicate what I have sketched once first but where. On the next values along of the interval? Or do I squeeze 2 into that frame.
The range of values X can be is where I sketch it right? with the values I need being Y values.
I have a problem on an A2 maths question, I think C3 if this helps.
The Question is:
The function f is even, periodic with period 2 and, for X 0-1 (can be 0 and 1), f(X)=X. Sketch the graph of f(X) = 1-X
How do I sketch graphs depending on whether they are even/odd, what do do with different periods and the range of values X can take?
I assume the period means I might just duplicate what I have sketched once first but where. On the next values along of the interval? Or do I squeeze 2 into that frame.
The range of values X can be is where I sketch it right? with the values I need being Y values.