Suppose you are an event coordinator for a large performance theater. One of the hottest new Broadway musicals has started to tour and your city is the first stop on the tour. You need to supply information about projected ticket sales to the box office manager. The box office manager uses this information to anticipate staffing needs until the tickets sell out. You provide the manager with a quadratic equation that models the expected number of ticket sales for each day x. ( x=1 is the day tickets go on sale).
Tickets= -0.2x^2 + 12x + 11
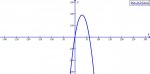
Does the graph of this equation open up or down? How did you determine this?
My answer: This graph opens downward because the leading coefficient is negative, a<0.
Describe what happens to the tickets sales as time passes.
My answer: They peak and then decrease.
Use the quadratic equation to determine the last day that tickets will be sold.
Note. Write your answer in terms of the number of days after ticket sales begin.
Will tickets peak or be at a low during the middle of the sale? How do you know?
My answer: Peak, because the vertex represents the middle of the sale and the vertex is at the very top of the parabola.
After how many days will the peak or low occur?
How many tickets will be sold on the day when the peak or low occurs?
What is the point of the vertex? How does this number relate to your answers in the two previous questions?
My answer: (6, 47)
How many solutions are there to the equation ? How do you know?
What do the solutions represent? Is there a solution that does not make sense? If so, in what ways does the solution not make sense?
I have answered a few but am not sure if they are right. My graph didn't seem to look like a parabola, it looked more linear to me. Here is what I did:
f(x)=-0.2x^2+12x+11
-0.2(x^2+x )+11
-0.2(x^2+x+36-36)+11
-0.2(x^2+x+36) + (36+11)
-0.2(x+12/2)^2 +47
Can you please let me know where I went wrong?
Tickets= -0.2x^2 + 12x + 11
Does the graph of this equation open up or down? How did you determine this?
My answer: This graph opens downward because the leading coefficient is negative, a<0.
Describe what happens to the tickets sales as time passes.
My answer: They peak and then decrease.
Use the quadratic equation to determine the last day that tickets will be sold.
Note. Write your answer in terms of the number of days after ticket sales begin.
Will tickets peak or be at a low during the middle of the sale? How do you know?
My answer: Peak, because the vertex represents the middle of the sale and the vertex is at the very top of the parabola.
After how many days will the peak or low occur?
How many tickets will be sold on the day when the peak or low occurs?
What is the point of the vertex? How does this number relate to your answers in the two previous questions?
My answer: (6, 47)
How many solutions are there to the equation ? How do you know?
What do the solutions represent? Is there a solution that does not make sense? If so, in what ways does the solution not make sense?
I have answered a few but am not sure if they are right. My graph didn't seem to look like a parabola, it looked more linear to me. Here is what I did:
f(x)=-0.2x^2+12x+11
-0.2(x^2+x )+11
-0.2(x^2+x+36-36)+11
-0.2(x^2+x+36) + (36+11)
-0.2(x+12/2)^2 +47
Can you please let me know where I went wrong?
") I have one more question. Should I substitute each day for X and then use the quadratic formula to get the answers for how many tickets were sold on each day?
I have one more question. Should I substitute each day for X and then use the quadratic formula to get the answers for how many tickets were sold on each day?