To find the straight line: \(\displaystyle \L y=mx+b\)
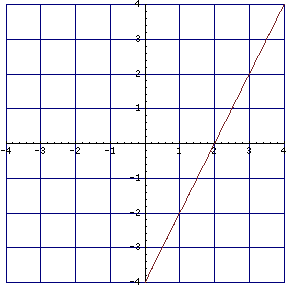
If you have a graph of a line like this:
\(\displaystyle \L y=mx+b\)
To find the
m(slope) you pick any two points on the line and and subtract the y's and the x's w/the subtraction of the y-coordinates on top andsubtraction of the x-coordinates ont the bottom.
So I will pick an two points to find our slope: \(\displaystyle \L (2,0)(1,-2)= \frac{0-(-2)}{2-1}=\frac{2}{1}\to2\)
So our equation is \(\displaystyle \L y=2x+b\)
Now to find the y-intercept \(\displaystyle \L b\) by filling any coordinate on the line:
\(\displaystyle \L 0=2(2)+b\)
\(\displaystyle \L 0=4+b\)
\(\displaystyle \L -4=b\)
So our equation is \(\displaystyle \L y=2x-4\)
If you fill in any coordinate \(\displaystyle \L y\) or \(\displaystyle \L x\) you will always get the other coordinate.
To find the line of best fit
One of the simplest things you can do is to find the slope between
each adjacent set of points.If you do this for the other pairs, you'll get a collection of slopes, and you could take the average of these.
Another thing you can do is plot the points on graph paper, and use a
ruler to draw the line that seems to go through the 'middle' of the
points, i.e., so that some of the points are above the line, while
others are below.
On the other hand, if this represents real data that someone really
cares about, you'd want to do something more sophisticated, like a
least-squares analysis. This has the same effect as finding the line
such that the sum of the squares of the distances from each point to
the line is minimized, which is one way of defining 'best'.
http://mathforum.org/library/drmath/view/63337.html