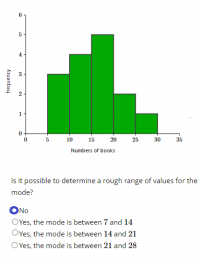
The mode it is not concerned with which bar of the histogram is the tallest. The bars of the histogram mask all information about whether or not there are any repeated individual values, so I think I could not estimate those values. Is there any way I could estimate the mode? Thank you.
You are using an out of date browser. It may not display this or other websites correctly.
You should upgrade or use an alternative browser.
You should upgrade or use an alternative browser.
Measures of central tendency-Histogram
- Thread starter Zelda22
- Start date
Dr.Peterson
Elite Member
- Joined
- Nov 12, 2017
- Messages
- 16,749
That's an interesting question, because some students are actually taught a formula for the "mode" of such a grouped distribution. What that formula actually gives is a reasonable guess, assuming the underlying distribution is smooth. So it is definitely possible to make an estimate; but there is no guarantee that that estimated interval will be correct.The mode it is not concerned with which bar of the histogram is the tallest. The bars of the histogram mask all information about whether or not there are any repeated individual values, so I think I could not estimate those values. Is there any way I could estimate the mode? Thank you.
So the answer depends on just what they mean by "rough range".
This is very confusing for me.
The possible data points for each bar 5
5-9 (3 data points) Possible repeated values 3,2
10-14 (4 data points) Possible repeated values 4,3,2
15-19 (5 data points) Possible repeated values 5,4,3,2
20-24 ( 2 data points) Possible repeated values 2
25-29 ( 1 data point) Possible repeated values 0
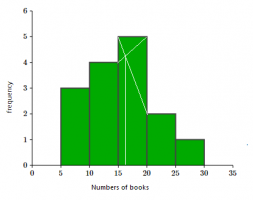
I found this way to find the mode graphically, but I don't think I could get the mode like this.
-Identify the highest rectangle.
-Join the top corners with the immediately next corners of the adjacent rectangles. The two lines must be cutting each other.
-Let the point where the joining lines cut each other be 'A'. Draw a perpendicular line from point A onto the x-axis. The point 'P' where the perpendicular will meet the x-axis will give the mode.
The possible data points for each bar 5
5-9 (3 data points) Possible repeated values 3,2
10-14 (4 data points) Possible repeated values 4,3,2
15-19 (5 data points) Possible repeated values 5,4,3,2
20-24 ( 2 data points) Possible repeated values 2
25-29 ( 1 data point) Possible repeated values 0
I found this way to find the mode graphically, but I don't think I could get the mode like this.
-Identify the highest rectangle.
-Join the top corners with the immediately next corners of the adjacent rectangles. The two lines must be cutting each other.
-Let the point where the joining lines cut each other be 'A'. Draw a perpendicular line from point A onto the x-axis. The point 'P' where the perpendicular will meet the x-axis will give the mode.
Attachments
Last edited:
BigBeachBanana
Senior Member
- Joined
- Nov 19, 2021
- Messages
- 2,277
Here's my take on this question. Let's assume there's only one mode. Which range would the mode belong to?This is very confusing for me.
The possible data points for each bar 4
5-9 (3 data points) Possible repeated values 3,2
15-19 (5 data points) Possible repeated values 4,3,2
20-24 ( 2 data points) Possible repeated values 2
25-29 ( 1 data point) Possible repeated values 0
I found this way to find the mode graphically, but I don't think I could get the mode like this.
-Identify the highest rectangle.
-Join the top corners with the immediately next corners of the adjacent rectangles. The two lines must be cutting each other.
-Let the point where the joining lines cut each other be 'A'. Draw a perpendicular line from point A onto the x-axis. The point 'P' where the perpendicular will meet the x-axis will give the mode.
Now, let's assume all the modes in the said range are repeated. Which range would the mode belong to?
Possible data point for each bar 5
5-9 (3 data points) Possible repeated values (3+0), (2+1)
10-14 (4 data points) Possible repeated values (4+0), (3+1),(2+2)
15-19 (5 data points) Possible repeated values (5+0), (4+1),(3+2), (2+1+1+1), (2+2+1)
20-24 ( 2 data points) Possible repeated values (2+0)
25-29 ( 1 data point) Possible repeated values 0
5-9, 10-14, 15-19, and 20-24 could all have values repeated twice, and (10-14) and (15-19) could have two values repeated twice.
I don't have an option from 5 to 24. Plus could be any other value. So I don't think is possible here.
Last edited:
Dr.Peterson
Elite Member
- Joined
- Nov 12, 2017
- Messages
- 16,749
Yes, that's the basis of the formula I was referring to which can be found here:I found this way to find the mode graphically, but I don't think I could get the mode like this.
-Identify the highest rectangle.
-Join the top corners with the immediately next corners of the adjacent rectangles. The two lines must be cutting each other.
-Let the point where the joining lines cut each other be 'A'. Draw a perpendicular line from point A onto the x-axis. The point 'P' where the perpendicular will meet the x-axis will give the mode.

This would give [math]15+\frac{5-4}{(5-4)+(5-2)}5=15+\frac{5}{4}=16.25[/math]
This answer is a reasonable guess, but can't be the mode of the actual underlying data, since it isn't a whole number.
It is most likely that the actual mode is in or near the modal class; but it's conceivable that the actual data are
7,8,9, 11,12,13,14, 15,16,17,18,19, 23,23, 26
in which case the mode is 23, though that is in the class with second-lowest frequency!
So I'll say again, we can estimate that the mode is likely to be in the modal class, but have no certainty except that it can't be in the class with frequency 1. And this reinforces the fact that the mode of a small dataset is not very significant.
Thank you. So No would be the right answer to his question?Yes, that's the basis of the formula I was referring to which can be found here:
This would give [math]15+\frac{5-4}{(5-4)+(5-2)}5=15+\frac{5}{4}=16.25[/math]
This answer is a reasonable guess, but can't be the mode of the actual underlying data, since it isn't a whole number.
It is most likely that the actual mode is in or near the modal class; but it's conceivable that the actual data are
7,8,9, 11,12,13,14, 15,16,17,18,19, 23,23, 26
in which case the mode is 23, though that is in the class with second-lowest frequency!
So I'll say again, we can estimate that the mode is likely to be in the modal class, but have no certainty except that it can't be in the class with frequency 1. And this reinforces the fact that the mode of a small dataset is not very significant.
Dr.Peterson
Elite Member
- Joined
- Nov 12, 2017
- Messages
- 16,749
I'll repeat:Thank you. So No would be the right answer to his question?
So the answer depends on just what they mean by "rough range".
If you take it to mean "an interval in which the true mode must lie" (that is, the "roughness" means being an interval rather than a precise number), the answer is no; if you take it to mean "an interval in which the true mode is likely to lie" (that is, the "roughness" means not being certain), the answer may be 14 to 21, which extends the modal class slightly to make the likelihood greater. I prefer the former, because of the wording "the mode is between ...".
Ask your teacher, or the author of the problem!