You are using an out of date browser. It may not display this or other websites correctly.
You should upgrade or use an alternative browser.
You should upgrade or use an alternative browser.
Increasing or Decreasing Trig Function
- Thread starter harpazo
- Start date
- Joined
- Nov 24, 2012
- Messages
- 3,021
Since the inequality is strict, you'd want an open interval. Without the calculus, a graph would be a good alternate. Or visualizing a point moving along the unit circle in a counter-clockwise direction from (0,-1) to (0,1) and what is happening to the \(y\)-coordinate of the point.
harpazo
Full Member
- Joined
- Jan 31, 2013
- Messages
- 891
Since the inequality is strict, you'd want an open interval. Without the calculus, a graph would be a good alternate. Or visualizing a point moving along the unit circle in a counter-clockwise direction from (0,-1) to (0,1) and what is happening to the \(y\)-coordinate of the point.
Calculus 1 shows a better, more precise and efficient graph. How is y = sin x placed on the xy-plane via Calculus 1 techniques? What happens to the y-coordinate as a point moves from (0, -1) to (0, 1) on the unit circle?
harpazo
Full Member
- Joined
- Jan 31, 2013
- Messages
- 891
Unless this is for a calculus course the answer is yes.
But there is one small correction. \(-\frac{\pi}{2}<x<\frac{\pi}{2}\) is \(\left(\frac{-\pi}{2},\frac{\pi}{2}\right)\)
Yes, I forgot that we use parentheses in terms of the symbols less than or greater than when expressing in interval notation.
- Joined
- Nov 24, 2012
- Messages
- 3,021
What happens to the y-coordinate as a point moves from (0, -1) to (0, 1) on the unit circle?
Visualize it, and tell me what you see...
harpazo
Full Member
- Joined
- Jan 31, 2013
- Messages
- 891
Visualize it, and tell me what you see...
What about using calculus to get a better picture? We can look at the slope (the derivative) of the graph. I have not studied derivative IN FULL but I do recall that the
derivative of sin x is cos x.
I also know that cos x is positive from -pi/2 to < pi/2. So, the slope of sin x is positive, it is increases in that interval. Yes?
I say at –pi/2 and pi/2, cos x = 0. I conclude that sin x is not increasing or decreasing. The slope is zero. Yes?
- Joined
- Nov 24, 2012
- Messages
- 3,021
Visualize it, and tell me what you see...
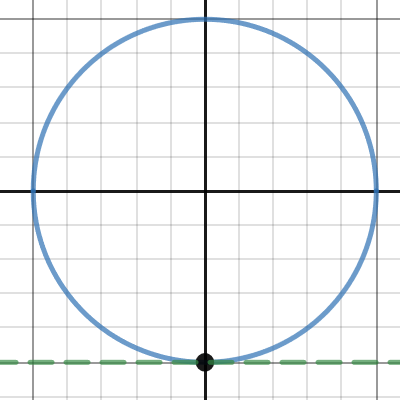
Move the slider from left to right...as you do watch the point and the horizontal dashed line through the point. As the angle \(a\) increases from [MATH]-\frac{\pi}{2}[/MATH] to [MATH]\frac{\pi}{2}[/MATH] the point and line move up, that is, increase.

Desmos | Graphing Calculator
Otis
Elite Member
- Joined
- Apr 22, 2015
- Messages
- 4,592
At your stage, harpazo, I don't think that's a good idea. I'd use basic trigonometry, first.What about using calculus to get a better picture …
The terminal ray of any angle intersects the unit circle at a point. As you trace the unit circle from points (1,0) to (0,1), for example, you're moving through angles in the first quadrant -- that is, between 0 radians (0º) and pi/2 radians (90º).
This is what happens to the x- and y-coordinates of points on the unit circle, as those first-quadrant angles increase: The x-coordinate decreases from 1 to 0, and the y-coordinate increases from 0 to 1. An animated unit-circle tool is available here.
sin(angle) = y-coordinate of point on unit-circle
cos(angle) = x-coordinate of point on unit circle
Therefore, sine increases on the interval (0,pi/2) because the y-coordinates on the unit circle are increasing. Likewise, cosine decreases because the x-coordinates are getting smaller.
Picture angles in the other three quadrants. Visualize tracing the circle in each quadrant. If you can see what's happening to the y-coordinates, then you know what sine is doing.
Memorizing these patterns helped me a lot, when I studied beginning trigonometry.
?
harpazo
Full Member
- Joined
- Jan 31, 2013
- Messages
- 891
Move the slider from left to right...as you do watch the point and the horizontal dashed line through the point. As the angle \(a\) increases from [MATH]-\frac{\pi}{2}[/MATH] to [MATH]\frac{\pi}{2}[/MATH] the point and line move up, that is, increase.

Desmos | Graphing Calculator
www.desmos.com
I did see that when playing with graph you provided.
harpazo
Full Member
- Joined
- Jan 31, 2013
- Messages
- 891
At your stage, harpazo, I don't think that's a good idea. I'd use basic trigonometry, first.
The terminal ray of any angle intersects the unit circle at a point. As you trace the unit circle from points (1,0) to (0,1), for example, you're moving through angles in the first quadrant -- that is, between 0 radians (0º) and pi/2 radians (90º).
This is what happens to the x- and y-coordinates of points on the unit circle, as those first-quadrant angles increase: The x-coordinate decreases from 1 to 0, and the y-coordinate increases from 0 to 1. An animated unit-circle tool is available here.
sin(angle) = y-coordinate of point on unit-circle
cos(angle) = x-coordinate of point on unit circle
Therefore, sine increases on the interval (0,pi/2) because the y-coordinates on the unit circle are increasing. Likewise, cosine decreases because the x-coordinates are getting smaller.
Picture angles in the other three quadrants. Visualize tracing the circle in each quadrant. If you can see what's happening to the y-coordinates, then you know what sine is doing.
Memorizing these patterns helped me a lot, when I studied beginning trigonometry.
?
Why did you use parentheses to show the interval (0, pi/2) and not brackets [0, pi/2]?
