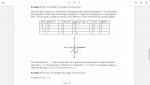
\(\displaystyle \mbox{Graph the fun}\mbox{ction: }\, g(u)\, =\, \begin{cases}u\, -\, 1,&\mbox{if }\, u\, <\, 0 \\ u^2\, -\, 2u\, -\, 3,&\mbox{if }\, 0\, \leq\, u\, \leq\, 3 \\ 0,&\mbox{if }\, u\, >\, 3 \end{cases}\)
There are three equations to contend with, depending on the value of the domain, u. So I will graph three equations on the same axis starting with negative u-values and working up to u-values greater than 3. On the graph, u-values are on the x-axis. Below is a chart of ordered pairs for the equation.
u < 0
| g(u) = u - 1 | | -2 | -2 - 1 = -3 | | -1 | -1 - 1 = -2 | | 0 | 0 - 1 = -1 |
|
|
| |
0 < u < 0
| g(u) = u2 - 2u - 3 | | 0 | 0 - 0 - 3 = -3 | | 1 | 1 - 2 - 3 = -4 | | 2 | 4 - 4 - 3 = -3 | | 3 | 9 - 6 - 3 = 0 |
| | |
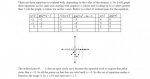
The ordered pair (0, -1) has an open circle on it (on the graph) because the equation used to acquire that point states that u < 0. So all points on that line are valid until u = 0. So this set of equations makes a function; the range is {y | y < 0} and the zeroes are x > 3.
can you explain why there is ordered pair (0,-1) when u < 0?
As the explanation stated, the grapher was taking points within the domain (or at the edge) in order to complete that portion of the graph. Because "u = 0" is not actually within that rule's domain, the point is not actually on that portion of the graph. However, how else would one know where to draw the line, if not by finding that edge-point? So the edge-point is found, according to the rule, but an open dot is drawn, indicating that the first rule's line goes up to, but does not quite include, the edge-point.
and why the range is {y|y ≤ 0} but not {y|-4 ≤ y ≤ 0}
If you've forgotten what linear functions (such as "y = x - 1") look like, then plot some more points for the first rule. That is, extend the graph. Then you should see that the graph does indeed go below the value y = -4.
")