I have a issue that I would like to solve and am hoping someone can help me with how to approach this. I am really looking for the approach and not just the answer. In the end I could make a look up table in excel provide me my answer.
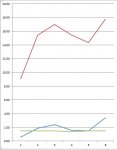
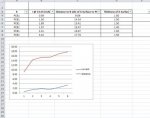
In the graph below, I want to develop the function to calculate for any value on the red line it outputs the coorolating value on the blue line. Although not perfectly correlated, it is close enough that I am hoping to approximate this behavior.
If your interested in the problem I am trying to solve, here it is. I have a light source under a opaque plastic surface with a graphic on it. The red line is the distance of the light source to the plastic. The blue line is the electrical current required to meet the intensity requirement on other side of plastic. I am hoping to make a function for this behavior so that I can quickly determine the current I need based on a changing distance. So as the light source moves, I can keep the intensity the same for the person viewing it. Hope this is fun for someone. Thanks in advance for the help.


