histogram class width

red and white kop!

Junior Member
Joined
Jun 15, 2009
Messages
231
okay im just starting statistics so lets be indulgent
i am told in my book that when drawing histograms involving discrete data the class widths must be moved minus half a unit in order to represent im not sure what

anyway is this always necessary, and is this the case with continuous data as well? i like understanding everything so somebody please explain clearly.
 
I'm not sure what, either. I cannot remember learning about horizontal shifts with these types of charts.

Not to be picky, but there is a difference between a bar chart and a histogram.

Some instructors (wrongly) refer to bar charts as histograms.

With a histogram, it's the relative areas of the rectangles that need to be proportional; the widths are not constant.

With a bar chart, it's the relative heights of the rectangles that need to be proportional; the widths are constant.

Do you know which type of chart it is?

Can you please explain more about what your book says regarding moving the widths? Does this mean moving the rectangles? Does it mean changing the widths, not moving them?

I'm trying to get a better sense of what you're looking at.
 
ha ha now we're talking! im aware of the difference between a histogram and a bar chart and my book makes a clear distinction between the both, this is a specifically stat syllabus after all. my book says exactly:
"in order to draw a histogram for a discrete variable it is NECESSARY that each value is represented by a bar extending half a unit on each side of that value so that the bars touch. For example, the value 1 is represented by a bar extending from 0.5 to 1.5, and the group of values 0-9 by a bar extending from -0.5 to 9.5."

i have many questions concerning this text. firstly, why is this necessary? is this only applicable to discrete data? why? is this always necessary like the text says or do few people follow this rule? is it only applicable to histograms or bar charts as well?
i cant understand this thing properly if its not explained inside-out, half-hearted explanations confuse me. also, some of the histograms presented in the book for continuous data seem to shift bars as well but nothing is said about it. only the section on discrete data explains this.
 
Okay, I think I get it now.

I was thinking that each rectangle represented a range of discrete values (i.e., the first bar is for 1-2-3, the next bar is for 4,5,6, et cetera).

If there is to be a bar representing each number, say, 444,445,446,447,448, then technically, we would have five line segments rising above our horizontal axis.

By drawing these line segments 1 unit "thick", centered horizontally about the line segment, then the line "segments" would touch. In other words, they are giving the discrete numbers "thickness" by extending the width of their representational line "segments" by 0.5 units to both left and right.

Could this be a correct interpretation of your text?

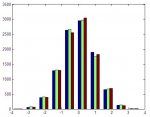
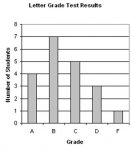
I don't think it's always necessary to follow such a convention. The following histograms are for discrete values. (Image histo2 is not labeled very well.) Double-click images, to expand.

[attachment=0:29m0u76b]histo6.JPG[/attachment:29m0u76b]

[attachment=2:29m0u76b]histo2.JPG[/attachment:29m0u76b]

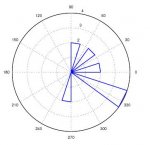
This next one is a histogram in polar coordinates to model the following set of discrete wind directions (in degrees) and frequencies.

{12, 12, 44, 44, 82, 82, 261, 261, 332, 332, 332, 332}

I'm not sure about the relative areas in this one! The values are represented by isoceles triangles whose bases are centered on a radial line.

[attachment=1:29m0u76b]histo3.JPG[/attachment:29m0u76b]
 

Attachments

  • histo2.JPG
    histo2.JPG
    20.6 KB · Views: 579
  • histo3.JPG
    histo3.JPG
    17.5 KB · Views: 579
  • histo6.JPG
    histo6.JPG
    17.8 KB · Views: 579
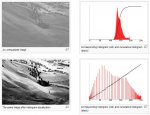
Two more.

The histogram equalizing algorithm for photo enhancement is an interesting example.

[attachment=3:1159sa4o]histo4.JPG[/attachment:1159sa4o]

[attachment=2:1159sa4o]histo5.JPG[/attachment:1159sa4o]
 

Attachments

  • histo4.JPG
    histo4.JPG
    58.6 KB · Views: 578
  • histo5.JPG
    histo5.JPG
    20.4 KB · Views: 578
Perhaps, your book sticks to basic examples, and they want to keep the width 1 unit.

Having a common width of 1 unit essentially changes the relative-area problem into a relative-height problem.

I dunno.
 
Top