First post here so I hope this is in the right spot.
I am working on a theoretical problem at the moment and it involves a decay issue that I cant get my head around how to correctly model. I have included a rough drawing of the problem but here is the description.
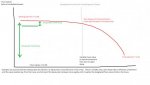
Take a theoretical element that has a characteristic of 'Efficiency'. Maximum efficiency rate is 100% and minimum efficiency rate is a variable 'floor'. The initial efficiency of the element is always 100%, but as usage of the element increases the efficiency drops. The problem is that I want the efficiency to drop at a very slow rate to start with, say only a 10% reduction until it reaches a set threshold, say when the usage of the element hits 70 out of 100. Once this threshold is surpassed the efficiency drops at a more accelerated rate until it hits the pre-determined 'floor' when usage reaches 100.
The key variables in the equation are:
Initial Decay = Rate of decay from initial usage until threshold is reached
Accelerated Decay = Rate of decay after the threshold is reached
Threshold Value = Usage value at which the rate of threshold changes
Floor Value = The lowest efficiency that the element will have. This will always occur when usage equals 100.
So basically starting point is: usage = 1 and Efficiency = 100. Final point is: usage = 100 and efficiency = floor value

I did think of applying two different decay functions to this problem, as in one for before and after the threshold, but I was hoping there might be a way that I could model it all as one function.
Note: While a solution would be great I am mainly after any guidance on the best way to approach solving this problem.
Many Thanks
Jason
I am working on a theoretical problem at the moment and it involves a decay issue that I cant get my head around how to correctly model. I have included a rough drawing of the problem but here is the description.
Take a theoretical element that has a characteristic of 'Efficiency'. Maximum efficiency rate is 100% and minimum efficiency rate is a variable 'floor'. The initial efficiency of the element is always 100%, but as usage of the element increases the efficiency drops. The problem is that I want the efficiency to drop at a very slow rate to start with, say only a 10% reduction until it reaches a set threshold, say when the usage of the element hits 70 out of 100. Once this threshold is surpassed the efficiency drops at a more accelerated rate until it hits the pre-determined 'floor' when usage reaches 100.
The key variables in the equation are:
Initial Decay = Rate of decay from initial usage until threshold is reached
Accelerated Decay = Rate of decay after the threshold is reached
Threshold Value = Usage value at which the rate of threshold changes
Floor Value = The lowest efficiency that the element will have. This will always occur when usage equals 100.
So basically starting point is: usage = 1 and Efficiency = 100. Final point is: usage = 100 and efficiency = floor value
I did think of applying two different decay functions to this problem, as in one for before and after the threshold, but I was hoping there might be a way that I could model it all as one function.
Note: While a solution would be great I am mainly after any guidance on the best way to approach solving this problem.
Many Thanks
Jason