programmaChase
New member
- Joined
- Feb 12, 2008
- Messages
- 2
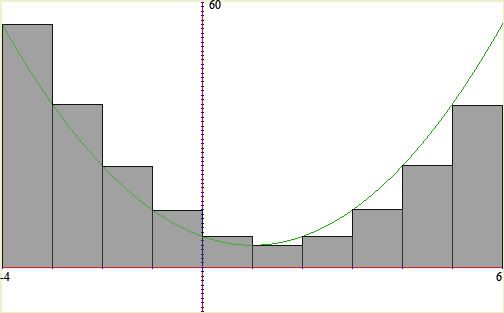
I'm not sure why I am having such trouble with this, but it has been boggling my mind for a couple hours now. How would I graph the limit of a summation in order to find the area under the curve 2x[sup:3efad7ua]2[/sup:3efad7ua] - 4x + 7 on the interval [-4,6] ? I've written the problem in sigma notation and solved it, yielding 275 sq. units, but looking back at my math I realize I have added 11 rectangles to obtain this answer when in fact in my graph of the summation I have only 10 rectangles to calculate the area under the curve (see below).

I know this is a very elementary question, but for whatever the reason I'm just not getting it. Thanks in advance for any help!
: rogrammaChase-::

I know this is a very elementary question, but for whatever the reason I'm just not getting it. Thanks in advance for any help!
:

