Graph questions about f(x)

salma

New member
Joined
Nov 28, 2012
Messages
17
Im working on my study guide..and I have no idea how to do these types of problems.Can anyone please just give me a hint on how I can approach these?
I attached the graph.

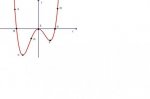
a few of the questions im having trouble with are:

At which point is f(x) > 0?
a) A b) B c) C d) D e) None of these

At which point is f'(x)> 0?
a) A b) B c) C d) D e) None of these

At which point is f'(x) =0 ?
a) A b) B c) C d) D e) None of these

For the 1st one, I said letters A and H. because those are the points in the Y-axis that are greater than 0.
For the 2nd & 3rd one, Im not sure how I can do them. Derivatives confuse me.Any feedback would be appreciated
 

Attachments

  • graph2.jpg
    graph2.jpg
    6.6 KB · Views: 1
You are correct on the first one.

For the others, picture a line tangent to the curve at the given points. The slope of the tangent line is equal to the value of the derivative at a given point.
 
How can I find the slope if there are no numbers on the graph? I remembered all this derivative stuff was very easy to me when I was learning it(a yr ago) but now its my hardest topic. Is there another way of solving this? or is finding the slope of the tangent line the only way
 
How can I find the slope if there are no numbers on the graph? I remembered all this derivative stuff was very easy to me when I was learning it(a yr ago) but now its my hardest topic. Is there another way of solving this? or is finding the slope of the tangent line the only way

You don't need to find the slope! You are never asked for specific values of the slope. The only thing you are asked about the derivative is where it is positive or negative. You don't need to calculate anything- you just need to think about what positive and negative slope mean.
 
ahh no wonder! so positive slope means when we view the graph of the line from left to right, as x increases, y increases too. and when its negative, as x increases y decreases. So for f ' (x)>0, Im looking at the graph to see at what point the graph increases above 0??
 
ahh no wonder! so positive slope means when we view the graph of the line from left to right, as x increases, y increases too. and when its negative, as x increases y decreases. So for f ' (x)>0, Im looking at the graph to see at what point the graph increases above 0??
Not where it increases "above zero" - just where it is increasing with increase of x.
Don't count points where the slope is horizontal - just the ones with a positive slope at the point - regardless of the value of y at the point.
 
Yes, so at which two points is \(\displaystyle f'(x)>0\)?
 
Thats what I dont know. I dont get how finding the points where the slope is positive gives me the derivitive. I probably sound stupid.but Ill guess with points E and H because they're the 2 points that gave me a positive slope when I drew tangents on them. If im wrong,which i probably am, I give up.and thanks for everyones help
 
Hey, I think I can speak for just about everyone who has ever studied anything that there are frustrating moments where you just want to throw up your hands and walk away. But don't give up, at least not just yet.

The derivative of a function is just a measure of how the function is changing with respect to its independent variable, in this case x. We normally think of x as increasing from left to right on a graph. Now, if the function is increasing with respect to x, then its derivative is positive, if the function is decreasing, then its derivative is negative, and if the function is stationary (neither increasing nor decreasing) then its derivative is zero.

On the interval [A,C) we see the function is decreasing, so at points A and B the derivative is negative. Notice that lines tangent to the curve at these two points would have negative slope.

At point C, we see then function is changing from decreasing to increasing, and we call this a stationary point. Here the derivative is zero. Notice that a line tangent to the curve here would be horizontal, meaning its slope is zero.

On the interval (C,E) we see the function is increasing, so at point D the derivative is positive. Notice that a line tangent to the curve at this point will have a positive slope.

At point E, we see then function is changing from increasing to decreasing, so this is another stationary point. And just like at point C, we see that a line tangent to the curve here would be horizontal, meaning its slope is zero, and so the derivative is zero here too.

On the interval (E,F) we see the function is decreasing, so the derivative is negative on this interval.

At point F we have another stationary point, so the derivative is zero there.

On the interval (F,H] we see the function is increasing, so the derivative is positive. So, at points G and H the derivative is positive.
 
ahh okk I think I finally understood everything. I answered them one final time and got D) for the second question, and C for the third. hope im right now!
 
Top