magical light
New member
- Joined
- Aug 15, 2013
- Messages
- 8
"Interpret" which "graph" how?I...would like to know how can you interpret the results from the graph.
")
"Interpret" which "graph" how?
Please reply with a clarification of the exercise, starting with which of the three graphed lines is the derivative to which you are referring, and including the full and exact statement of the related exercise, the complete instructions, and a clear listing of your thoughts and efforts thus far. Thank you!
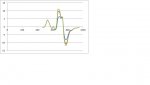
Um... no, sorry; that isn't "clear".All the three where the first derivative graphs but for different treatment . It is based on a biological data. The x axis is the wavelength and y for plants with 3 different treatments. I would like to know the change in the treatment when the wavelength changes .
Hope this is clear.
The first bit of gobblydegook has two clauses without a verb in either one. Are you not a native speaker of English?Hi,
All the three where the first derivative graphs but for different treatment . It is based on a biological data. The x axis is the wavelength and y for plants with 3 different treatments. I would like to know the change in the treatment when the wavelength changes .
Hope this is clear.
Thanks
Um... no, sorry; that isn't "clear".
In order to make some guess as to how to "interpret" these three first derivatives, it is necessary to have some idea to what these derivatives refer. "Different treatments based on data" does not, I'm afraid, clarify this sufficiently.
Kindly please reply with the requested information, or else extensive clarification of the "treatment", the "data", what was changed that resulted in the three different graphs, what you're attempting to measure, how you did your measurements, etc. Thank you!
The first bit of gobblydegook has two clauses without a verb in either one. Are you not a native speaker of English?
Are these graphs of the observations, of a function derived from the observations, or of that function's first derivative?
What do you mean by "interpret."That depends on what questions you are interested in.
You are implying that treatment is not an independent variable. So if the wavelength changes, the treatment changes? Presumably what you mean is that the different graphs are for different treatments and that y axis is for some variable that you have not specified (eg mass) that is a the dependent variable. But how do we know?
For us to help you, we need to know some things. What are you studying? What is your math training? Are you a native speaker of English? Most importantly we need the exact words of the problem.
If your statement of your exercise, in English, is incomprehensible to native-English speakers, then there is an issue, and it is "associated with [the] English language".I don't think my question was in anyway associated with English language.