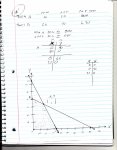
I was able to graph the equations.
Where I get confused is what part of the graph to shade and how to get the [coordinates of] the unknown intersecting [point]
It looks like you set up the system of inequalities correctly.
Your graph looks good, too, with one exception; do not extend the lines outside of Quadrant I.
Any point on either line that lies outside Quadrant I must have either a negative x-coordinate OR a negative y-coordinate. (There are no negative numbers of either rats or mice, in this exercise.)
Hence, you should also state the following inequalities:
x ≥ 0
y ≥ 0
It will also help other people looking at your work to understand your reasoning, if you state the definitions for symbols x and y as your
very first step:
x = the number of mice used per day
y = the number of rats used per day
Then use x and y throughout (do not use m and r simultaneously -- too many symbols).
You shaded the correct region. Only points on the solid lines or in that shaded region have (x,y) values that satisfy BOTH of your posted inequalities. Any other point is not part of the system's solution.
To find the intersection point, you could first solve each equation for y and equate the results. (Before solving for y, I suggest dividing both sides of each equation by 10 to reduce the numbers.)
After you equate the results for y, you'll have an equation that contains only the symbol x. Solve that equation for x.
Use the x-solution to calculate the corresponding y-coordinate (you may use one of the equations that you solved for y, to do this.)
EG:
5x + 4y = 1050
4x + 8y = 1200
Solve each for y:
y = (-5x + 1050)/4
y = (-4x + 1200)/8 = (-x + 300)/2
Equate the results to form an equation that contains only x:
(-5x + 1050)/4 = (-x + 300)/2
Give this method a try, and let us know if you get stuck.
Cheers :cool: