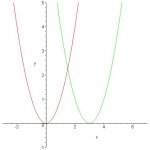
Again I'm not sure whether or not I am posting in the correct section, so please excuse me for this.
I was looking at the Blue SAT Book and I came across a graph question involving f(x). So they gave me a graph of f(x), then they asked me identify the graph f(x-1). Now first of all, I thought that if x is getting subtracted, shouldn't the graph move to the left since x is getting negative. Apparently, I was wrong and the graph f(x-1) actually moves to the right. From my friends I heard that it is this some weird rule. Can anybody explain this?
Right now, I only really know that f(x) is the same as y. f(x) changes according to the variable x and the end result is y.

