You are using an out of date browser. It may not display this or other websites correctly.
You should upgrade or use an alternative browser.
You should upgrade or use an alternative browser.
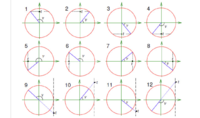
Decide which figure illustrate v=−arccos(t) ?
- Thread starter Nivelo
- Start date
Dr.Peterson
Elite Member
- Joined
- Nov 12, 2017
- Messages
- 16,604
First, think about the range of arccos, and eliminate some of the answers if v is not a valid value for the negative of an arccos.
Then think about whether t should represent a value of x, y, or something else.
Then narrow it down further from there.
What have you tried so far?
Then think about whether t should represent a value of x, y, or something else.
Then narrow it down further from there.
What have you tried so far?
pka
Elite Member
- Joined
- Jan 29, 2005
- Messages
- 11,974
First, think about the range of arccos, and eliminate some of the answers if v is not a valid value for the negative of an arccos.
Then think about whether t should represent a value of x, y, or something else.
Then narrow it down further from there.
What have you tried so far?
Thanks for the answer Dr Peterson, with your help i solved it.
I know arccos is in the first and second quadrant since the range is [0,pi], because of that -arccos should be in the 3rd and 4th quadrant. The t should represent a value on the x axis. From this i narrowed it down to the graph 8, which was correct.


