clannkelly
New member
- Joined
- Jan 29, 2012
- Messages
- 8
EDIT: I'm sorry, for some reason my pictures don't seem to be working. I'll try to look into it later when I've got more time.<br>
<br>
I just started Calculus I at university. It's been two weeks already and I'm still having an extremely difficult time with the concepts my teacher keeps presenting to me. I've never been a bad math student, but I do tend to run into trouble if I don't understand the purpose/point of the problems I'm working on. I was hoping someone on this forum could re-explain some basic calculus concepts to me. I'll list them below.<br>
<br>
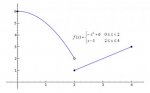
1.<br><img src="http://www.freemathhelp.com/forum/attachment.php?attachmentid=1660&stc=1" attachmentid="1660" alt="" id="vbattach_1660" class="previewthumb"><br>
This graph will help illustrate what I'm talking about. I understood the concept that as x approaches 2, the limit of f(x) is 2. Then, my teacher said that as x approaches 1, the limit of f(x) is 1. That didn't make sense to me, as there isn't a hole at f(x) = 1. I asked my teacher about it, and he said that that was because the function value and the limit value are the same at x=1 for f(x). I don't understand how that can happen. If there is a functional value for a given value of x, how can it also be a limit? I understood that a limit was a value that f(x) approaches as x approaches a certain number, but that f(x) never actually touches that limit. If the graph is touching the limit, how can it BE a limit? Isn't it just another part of the function?<br>
<br>
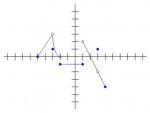
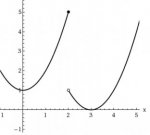
2. My teacher isn't a very wordy person, so he tends to avoid word problems in his assignments. He'll give us graphs like these:<br><img src="http://www.freemathhelp.com/forum/attachment.php?attachmentid=1661&stc=1" attachmentid="1661" alt="" id="vbattach_1661" class="previewthumb"><img src="http://www.freemathhelp.com/forum/attachment.php?attachmentid=1662&stc=1" attachmentid="1662" alt="" id="vbattach_1662" class="previewthumb"><img src="http://www.freemathhelp.com/forum/attachment.php?attachmentid=1663&stc=1" attachmentid="1663" alt="" id="vbattach_1663" class="previewthumb"><img src="http://www.freemathhelp.com/forum/attachment.php?attachmentid=1664&stc=1" attachmentid="1664" alt="" id="vbattach_1664" class="previewthumb"><br>
<br>
And ask us to find the limit, or something of that nature. I can usually do that, but I don't understand what it is I'm doing. Would it be possible for someone to describe to me what graphs like these would represent? Or, what kinds of real-world problems are solved and/or represented through the use of calculus/limits? I've looked this up before, but I've never gotten a clear answer. The most I can understand is that physicists use equations and graphs like this, but for what? If you have to use big words, don't worry about it. I would rather have big words than none at all. Another common graph he gives us is a series of horizontal lines, staggered like stairs. That usually represents the amount of some substance in a person's bloodstream over a given amount of time, and that makes sense to me. When I only have the visuals but not an explanation of what they represent, I get very easily confused by what it is I'm supposed to be figuring out. I'm not expecting a full description of these graphs in particular; they're only examples. I was really hoping for someone to describe a time when calculus, limits or derivatives came in handy for them, or were used on the job. Any help you can give me is greatly appreciated.<br>
<br>
3. This isn't so much a concept, but I was hoping for some clarification on this topic. It's about factoring out or otherwise playing with a function in order to evaluate the limit as something other than 0/0. This seems to happen a lot; for example, the question "lim as x-->1 of x^2-1 / x-1". If x equals 1, then the limit is 0/0, which is apparently not a correct answer. So, you play around with it and you end up with lim as x-->1 of x+1, which comes out to 2. Just so I'm clear, are x^2-1 / x-1 and x+1 the same function? If so, would the graph of the first one have no limit and the graph of the second have a limit? They seem identical.<br>
<br>
I'm sure I'll have a lot more questions as time goes by, but for now, I think that'll do. <img src="images/smilies/icon_wink.gif" border="0" alt="" title="" smilieid="4" class="inlineimg">
<br>
I just started Calculus I at university. It's been two weeks already and I'm still having an extremely difficult time with the concepts my teacher keeps presenting to me. I've never been a bad math student, but I do tend to run into trouble if I don't understand the purpose/point of the problems I'm working on. I was hoping someone on this forum could re-explain some basic calculus concepts to me. I'll list them below.<br>
<br>
1.<br><img src="http://www.freemathhelp.com/forum/attachment.php?attachmentid=1660&stc=1" attachmentid="1660" alt="" id="vbattach_1660" class="previewthumb"><br>
This graph will help illustrate what I'm talking about. I understood the concept that as x approaches 2, the limit of f(x) is 2. Then, my teacher said that as x approaches 1, the limit of f(x) is 1. That didn't make sense to me, as there isn't a hole at f(x) = 1. I asked my teacher about it, and he said that that was because the function value and the limit value are the same at x=1 for f(x). I don't understand how that can happen. If there is a functional value for a given value of x, how can it also be a limit? I understood that a limit was a value that f(x) approaches as x approaches a certain number, but that f(x) never actually touches that limit. If the graph is touching the limit, how can it BE a limit? Isn't it just another part of the function?<br>
<br>
2. My teacher isn't a very wordy person, so he tends to avoid word problems in his assignments. He'll give us graphs like these:<br><img src="http://www.freemathhelp.com/forum/attachment.php?attachmentid=1661&stc=1" attachmentid="1661" alt="" id="vbattach_1661" class="previewthumb"><img src="http://www.freemathhelp.com/forum/attachment.php?attachmentid=1662&stc=1" attachmentid="1662" alt="" id="vbattach_1662" class="previewthumb"><img src="http://www.freemathhelp.com/forum/attachment.php?attachmentid=1663&stc=1" attachmentid="1663" alt="" id="vbattach_1663" class="previewthumb"><img src="http://www.freemathhelp.com/forum/attachment.php?attachmentid=1664&stc=1" attachmentid="1664" alt="" id="vbattach_1664" class="previewthumb"><br>
<br>
And ask us to find the limit, or something of that nature. I can usually do that, but I don't understand what it is I'm doing. Would it be possible for someone to describe to me what graphs like these would represent? Or, what kinds of real-world problems are solved and/or represented through the use of calculus/limits? I've looked this up before, but I've never gotten a clear answer. The most I can understand is that physicists use equations and graphs like this, but for what? If you have to use big words, don't worry about it. I would rather have big words than none at all. Another common graph he gives us is a series of horizontal lines, staggered like stairs. That usually represents the amount of some substance in a person's bloodstream over a given amount of time, and that makes sense to me. When I only have the visuals but not an explanation of what they represent, I get very easily confused by what it is I'm supposed to be figuring out. I'm not expecting a full description of these graphs in particular; they're only examples. I was really hoping for someone to describe a time when calculus, limits or derivatives came in handy for them, or were used on the job. Any help you can give me is greatly appreciated.<br>
<br>
3. This isn't so much a concept, but I was hoping for some clarification on this topic. It's about factoring out or otherwise playing with a function in order to evaluate the limit as something other than 0/0. This seems to happen a lot; for example, the question "lim as x-->1 of x^2-1 / x-1". If x equals 1, then the limit is 0/0, which is apparently not a correct answer. So, you play around with it and you end up with lim as x-->1 of x+1, which comes out to 2. Just so I'm clear, are x^2-1 / x-1 and x+1 the same function? If so, would the graph of the first one have no limit and the graph of the second have a limit? They seem identical.<br>
<br>
I'm sure I'll have a lot more questions as time goes by, but for now, I think that'll do. <img src="images/smilies/icon_wink.gif" border="0" alt="" title="" smilieid="4" class="inlineimg">
Attachments
Last edited:


