I have been out of school for quite some time and don't use this type math much anymore, so here goes. I need an equation to figure out how to get the same projected amount of calls delivered to a remote call center for Fridays. Our remote call center receives 20% of our calls on days Monday through Thursday, but on Friday they close 4 hours prior to our call center closing. By contract they need to be sent the same amount of calls daily as they would have had they been open the full day. Let's say 1,000 calls daily total, 20% goes to them for 200 calls. How do I get them 200 calls by 5 without just sending them 200 calls all at once or going over or under? It doesn't have to be 200 exactly, but the percentage of total calls should average out to be very near 200.
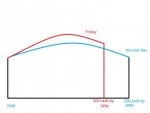
If this were a flat percentage, I would just write the equation for a 14 hour window at 20% = 10 hour window at x%, = 200 calls... but here's where it gets tricky... Call volumes are not flat throughout the day. It's a fairly consistent curve through the day when averaged over the last month or two of calls, peaking around noon, and tapering off later in the afternoon. I remember some of the things for figuring parabolic curves (which is what I think I need here), but I just can't remember how to plug this all in. See attached diagram. Help!
If this were a flat percentage, I would just write the equation for a 14 hour window at 20% = 10 hour window at x%, = 200 calls... but here's where it gets tricky... Call volumes are not flat throughout the day. It's a fairly consistent curve through the day when averaged over the last month or two of calls, peaking around noon, and tapering off later in the afternoon. I remember some of the things for figuring parabolic curves (which is what I think I need here), but I just can't remember how to plug this all in. See attached diagram. Help!
Attachments
Last edited:

