Calculus Help

ihateschool

New member
Joined
Jul 31, 2019
Messages
1
Could someone please show me how to sketch the graph of f'(x)?
Thank you :)
 

Attachments

  • IMG_6318.jpg
    IMG_6318.jpg
    458 KB · Views: 12
Does your textbook give no examples?

I'd probably start by finding places where the slope is zero, and putting a dot on the x-axis there, indicating that f'(x) = 0. Then I might estimate the slope of the straight line segment, which has constant slope, and draw a horizontal line at that value of y, showing that over that interval, f'(x) has that constant value. Then I'd estimate the slope of the curve at the other marked points, and put dots for those values of f'(x). Then I'd connect the dots. The fact that the curved portions look like parabolas, and I know the derivative of a quadratic function is linear, would encourage me to connect the dots with straight lines. Do you see why?

Now, make an attempt, and show us your work (as we ask you to do), so we can tell if you need correction.
 
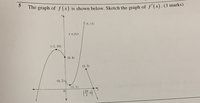
Do you know, at least that the derivative is the "slope of the tangent line"? You can't get exact values but you can estimate:
The graph starts out very steep, increasing so the derivative is initially a very large positive number decreasing until it is 0 at x= -2. It then becomes5- negative. At x= 0 the graph is not continuous so the derivative does not exist. Between x= 0 and x= 1, the derivative is negative but increases to 0 at x= 1. Between x= 1 and x= 5, the derivative increases to some large positive number. At x= 5. the function is again discontinuous so the is no derivative. For x larger than 5, the graph is a straight line so its derivative is a constant, the slope of the line that you can calculate: \(\displaystyle \frac{5- 0}{5- \frac{20}{3}}= \frac{5}{-\frac{5}{3}}= -3\). The graph of the derivative, for x> 5 is the horizontal line y= -3.
 
Top